
| Home |
| About |
| Products |
| Contact |
| Request Information |
| QC Pak Software |
| Links |
 |
Fluorescence QC Pak
- Alignment of Plate Transport
- Reproducibility
- Linearity
- Crosstalk
- Quality & Position of Filters
- Fluorophores in a solid plastic matrix: stable, even after 100 Million flashes
- MS Excel Evaluation Template, factory-calibrated Nominal Values
III's Fluorescence QC-Pak is the perfect tool for verification testing of all brands of Microplate Fluorometers. A QC-Pak consists of a plate with a number of organic compounds to evaluate the performance of the reader, and an Excel spreadsheet to calculate all parameters and to automatically generate a report, which can be printed and / or archived. The plate body is made of anodized aluminum that has lowest background fluorescence of any tested material. Green, Blue, and Red fluorophore in a solid plastic matrix is used to evaluate fluorescence readers. Each QC-Pak includes a disk with a MS Excel Evaluation Template and factory-calibrated "Nominal Values." Also available in rhodamine wavelengths.
Reproducibility
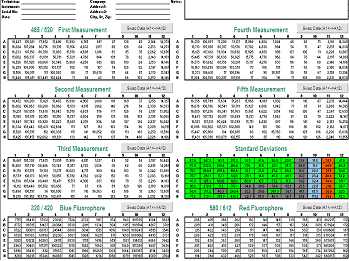
The plate is measured 5 times, the data is copied into the MS Excel Evaluation Template. Custom scripts to automatically import the data are possible. From these 5 Readings, If the CV of any well is outside the defined limit, the reader fails the reproducibility test.
Cross Talk
A positive well is surrounded by blank wells, and blank well is surrounded by positive wells, and in each case a ratio is taken to determine "spill over" or "cross talk" between wells. These are referred to by us as "best case" and "worst case" cross talk, respectively. Cross talk higher than 3 x 10⁻⁵ is considered "out of specification."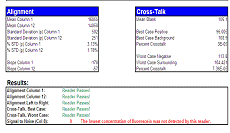
Alignment
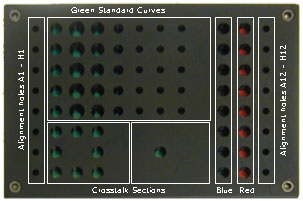
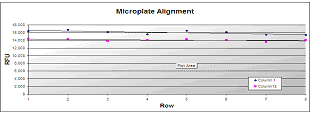
The plate has very deep and narrow wells in columns 1 and 12 to measure alignment. The software evaluates the linearity and consistency of these wells, and flags readers outside defined limits as "out of alignment."
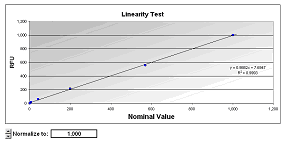
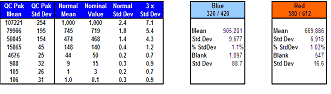
Linearity
The same fluorophore used in the alignment holes is also used at the microplate standard depth in a standard curve. Replicates of 5 different sized holes create the curve, and each plate comes with "Nominal Values" measured on a calibrated "Gold Standard" reader. The software plots the standard curves as well as flags readers that are not close enough to the Gold Standard. For the Linearity test, Cells A-E in Rows 2-9 contain the relevant data (i.e. A2-E2 contain the most concentrated sample, and the blank is A9-E9).
Filter Verification
The plate also includes strips of Red and Blue fluorophore, which are used to compare signal to background at alternate wavelengths. If a filter on a given reader is incorrect or has gone bad, then either the signal will be depressed or the background will be elevated, and the reader will fail at those wavelengths.
Copyright 2000 - 2011 Innovative Instruments, Inc. All rights reserved.